30DMC21
My attempts at the 30 Day Map Challenge for November 2021!
Project maintained by zaaaana Hosted on GitHub Pages — Theme by mattgraham
30 Day Map Challenge: by Zaana!
This is a quick website for all the maps I’ve made for 2021’s 30 Day Map Challenge. This is my first year participating and I’ve had a blast!
Even though it was not a requirement, I managed to complete a map for each day. My main motivations for this challenge were to revisit old techniques, learn new ones, and try to create whatever I can, even if it were a map done in 5 minutes’ time!
This was an amazing opportunity to build my confidence in mapping, as well as network with some amazing people in the field! I am a fan of every single person who made something this month, and I can’t wait to see what everyone gets up to in the future.
I also posted my maps daily on both Twitter and LinkedIn, so feel free to connect with me on either platform!
Now, let’s get into it!
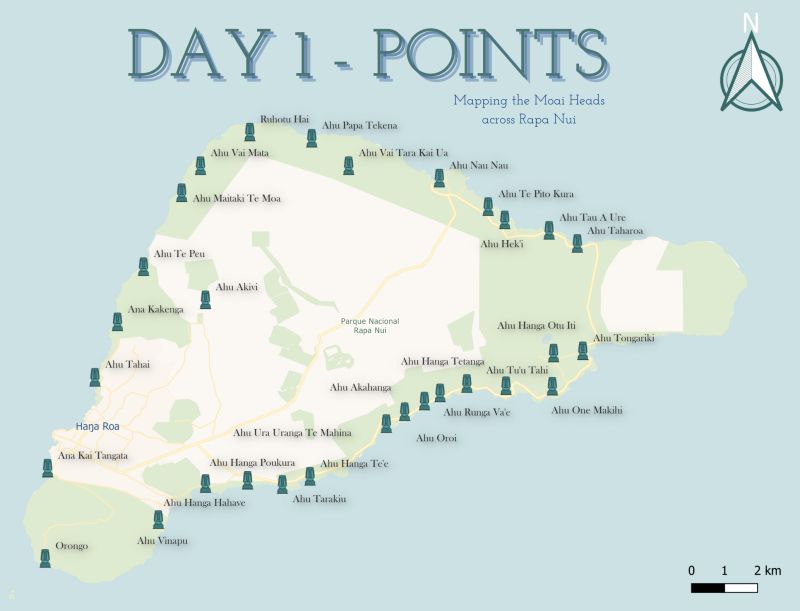
Day 1: Points
Created in QGIS. Map of Rapa Nui (Easter Island) highlighting locations of Moai statues
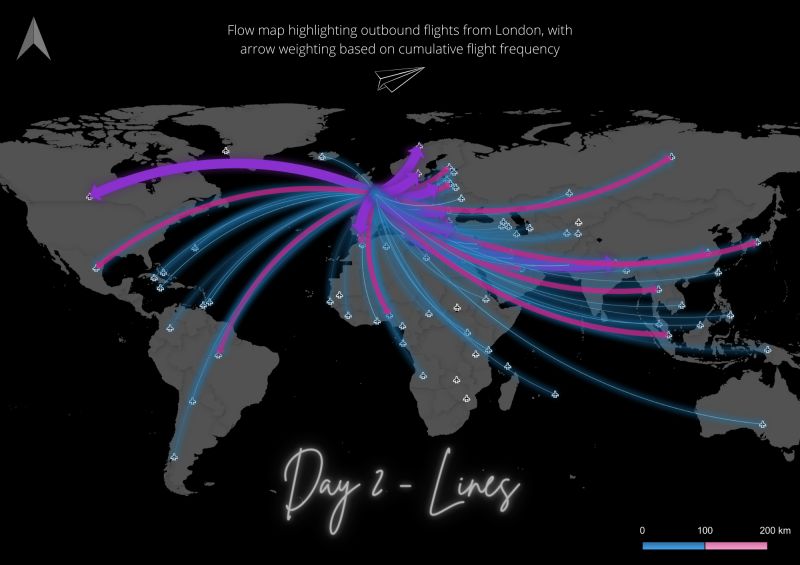
Day 2: Lines
Created in QGIS, with data processed in R. Map highlighting travel flow from the UK to the rest of the world
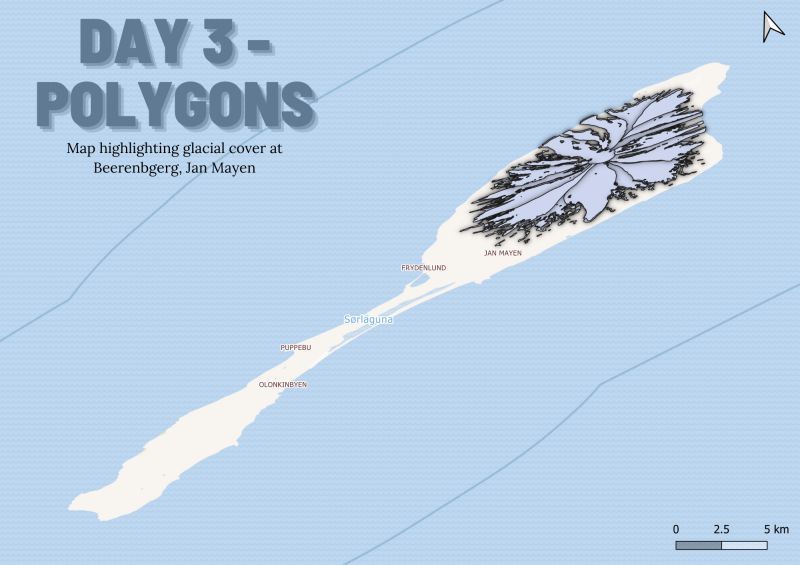
Day 3: Polygons
Created in QGIS. Simple polygon map showcasing the glacial cover of Jan Mayen, Svalbard
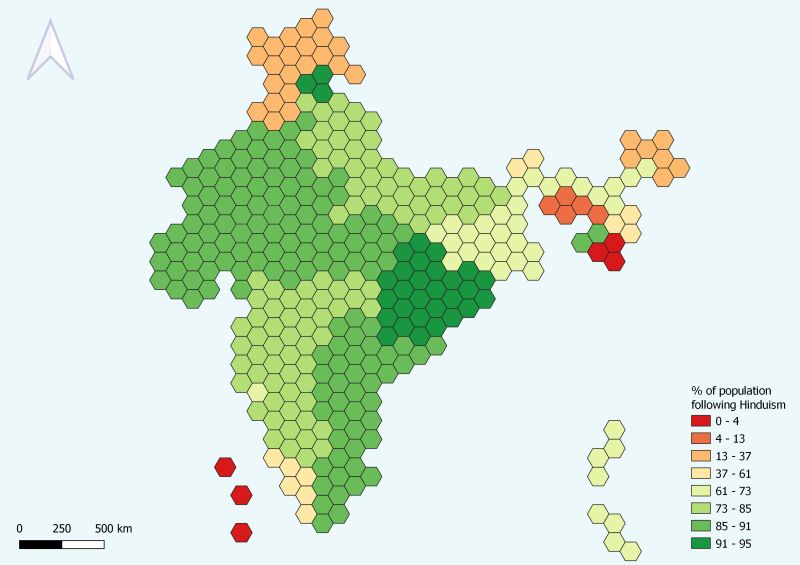
Day 4: Hexagons
Created in QGIS. Hex map of Indian states, highlighting percentage of Hindu population
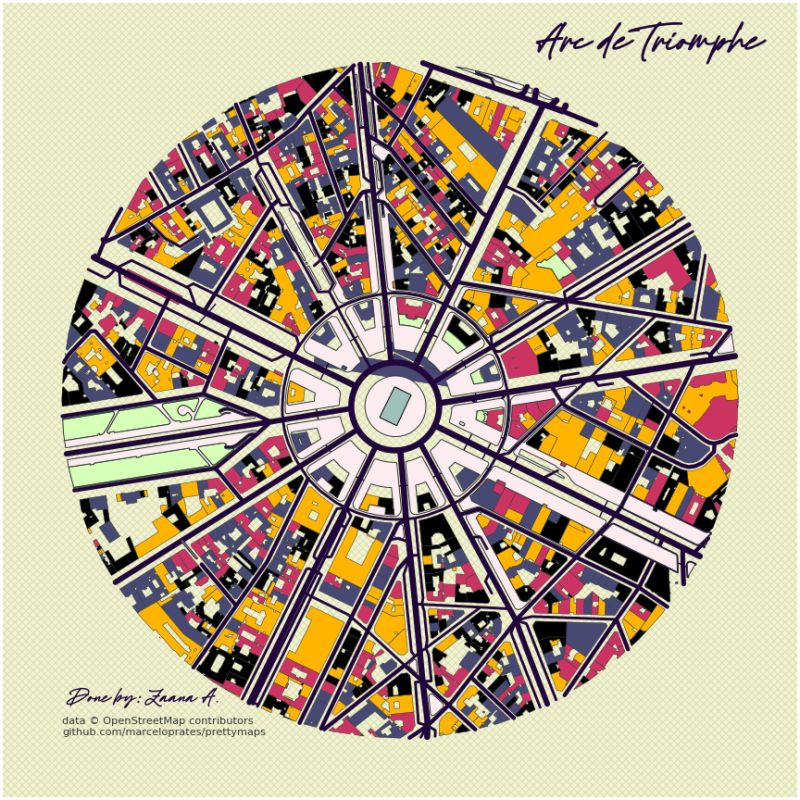
Day 5: Challenge 1: OpenStreetMap
Created in Python using the prettymaps package and data from Overpass Turbo
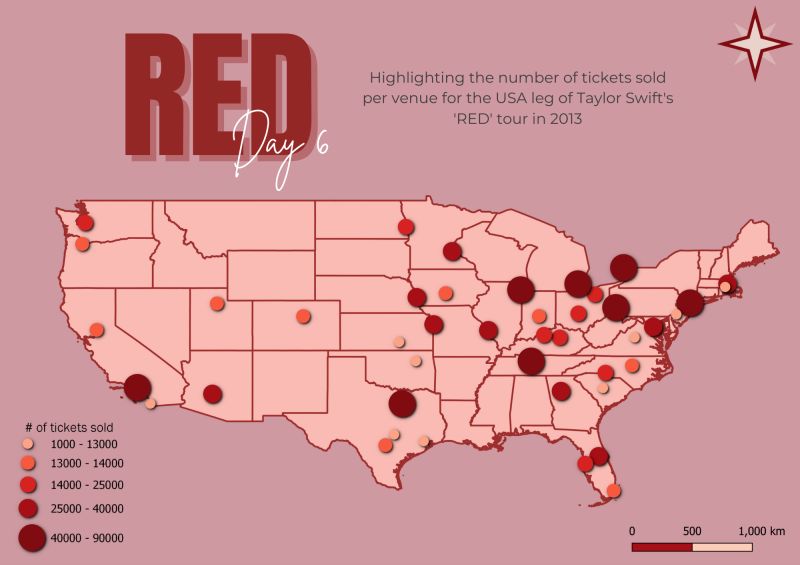
Day 6: Red (Taylor’s Version)
Created in QGIS. Quick map of # of ticket sales at each USA venue of Taylor Swift’s 2013 RED Tour
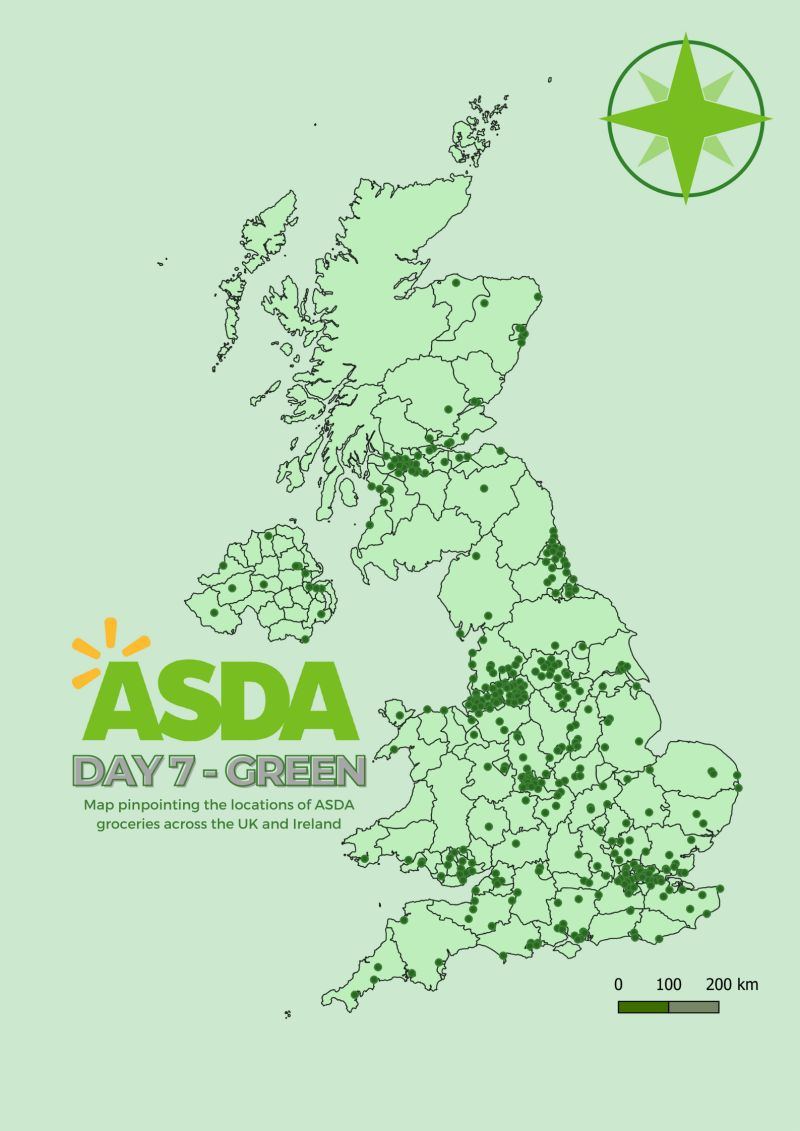
Day 7: Green
Created in QGIS. Point map highlighting ASDA locations in the UK
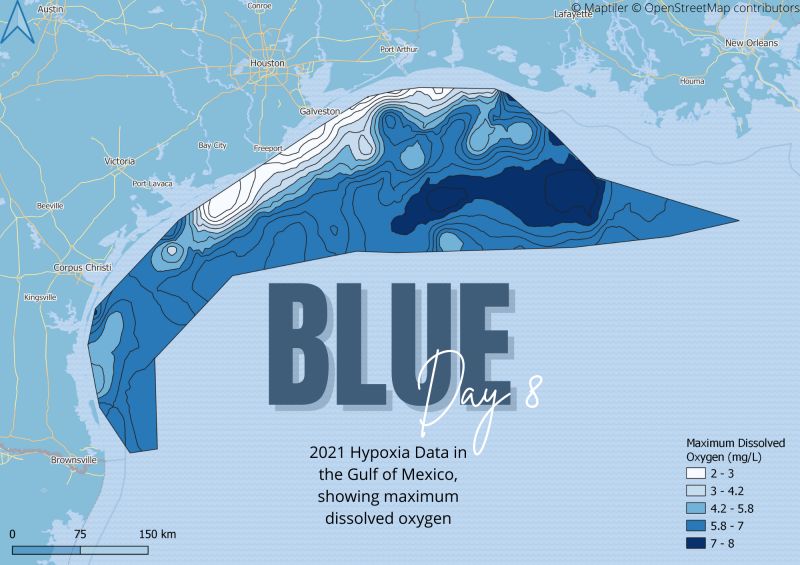
Day 8: Blue
Created in QGIS. 2021 Hypoxia data in the Gulf of Mexico, based on max. dissolved oxygen
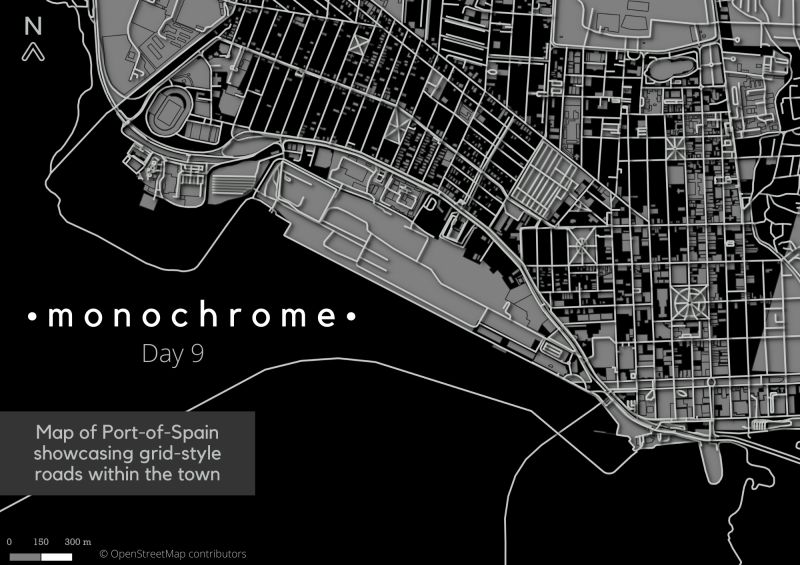
Day 9: Monochrome
Created in QGIS with data from Overpass Turbo. Map of the road network in Port of Spain, Trinidad
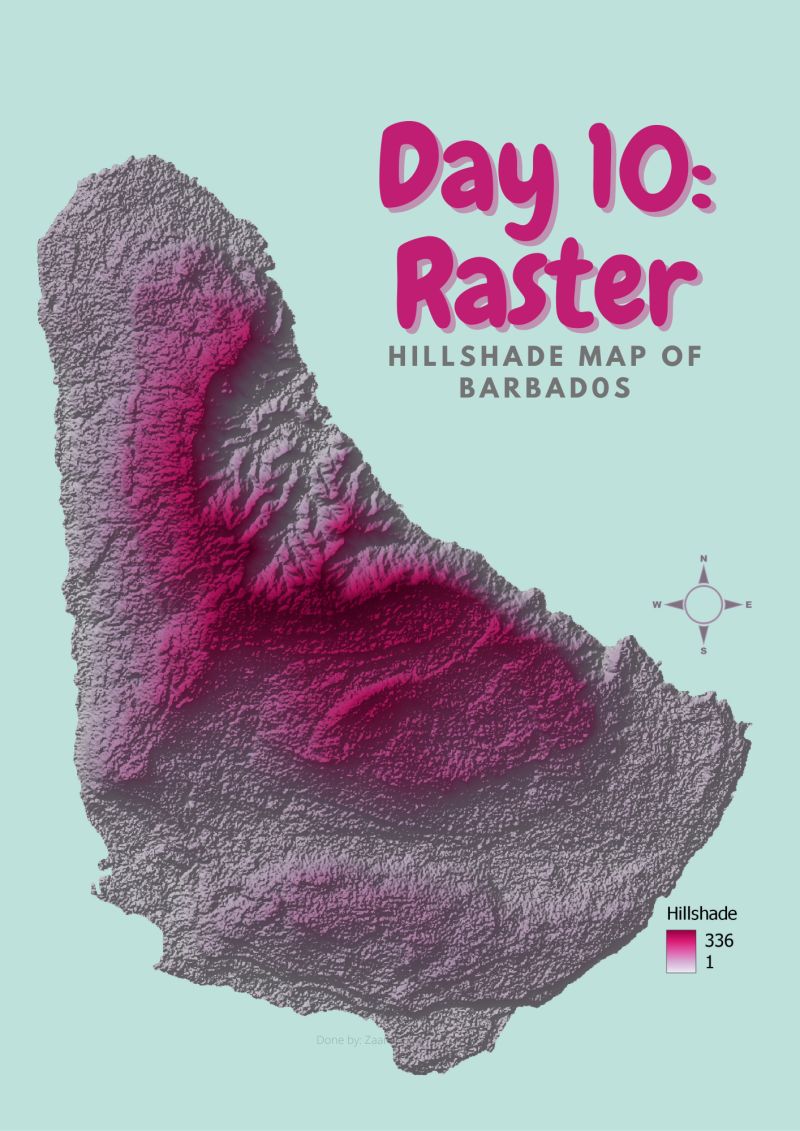
Day 10: Raster
Created in QGIS. Hillshade map of Barbados
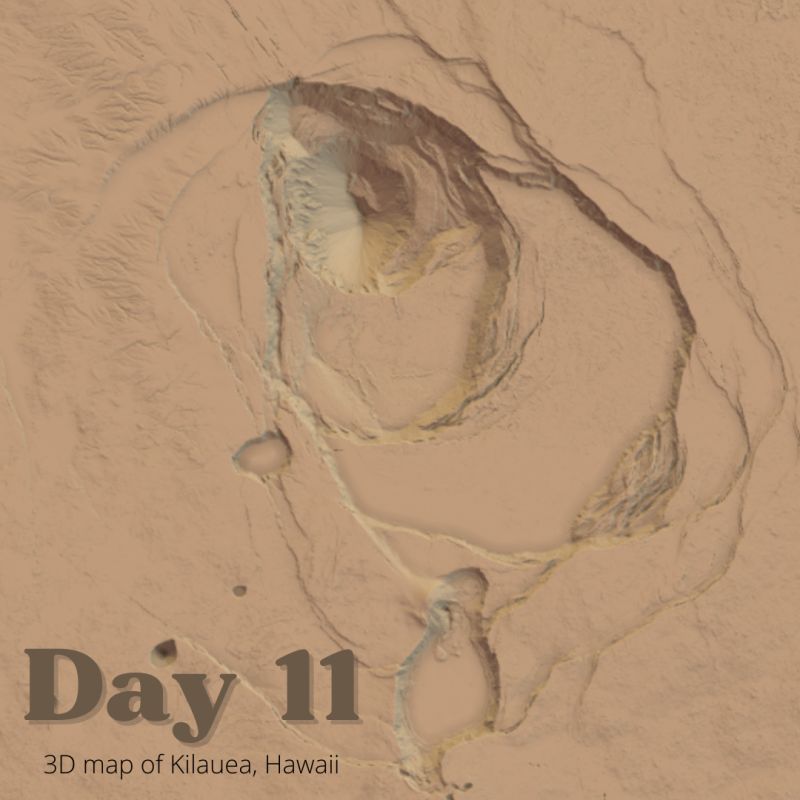
Day 11: 3D
Created in R with Rayshader. Plan view map of Kilauea, Hawaii. Rayshader attempt #1
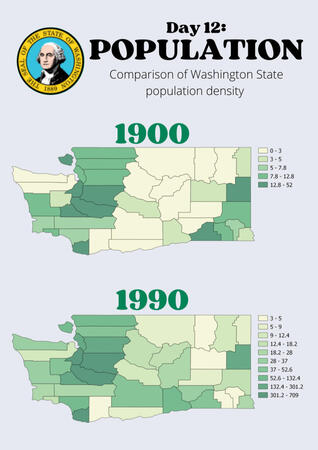
Day 12: Population
Created in QGIS. Population density changes in Washington
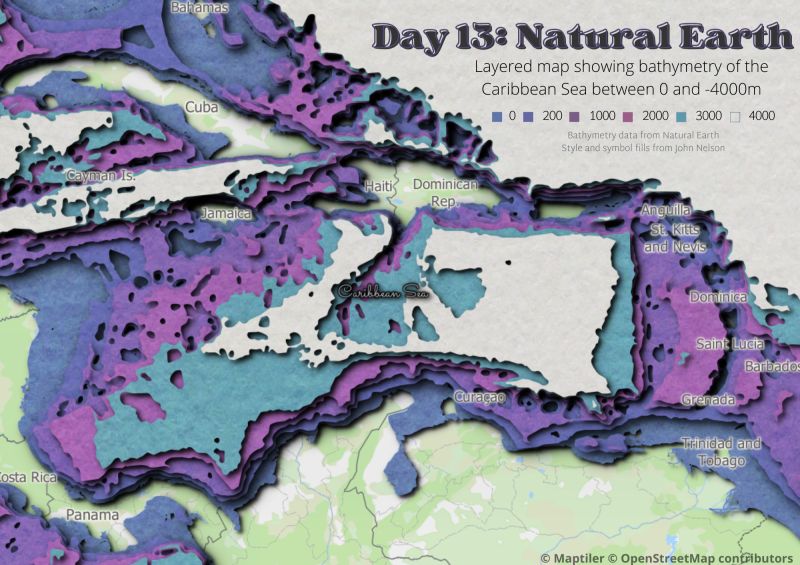
Day 13: Challenge 2: Natural Earth
Created in QGIS. Bathymetry properties of the Caribbean Sea. Symbology styles by John Nelson
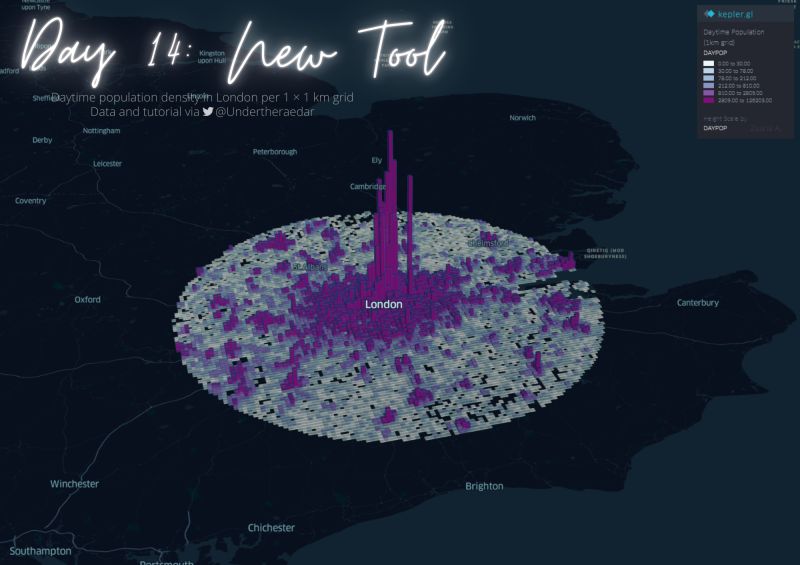
Day 14: New Tool
Created in kepler.gl. Population Density of London, following the tutorial by Alasdair Rae
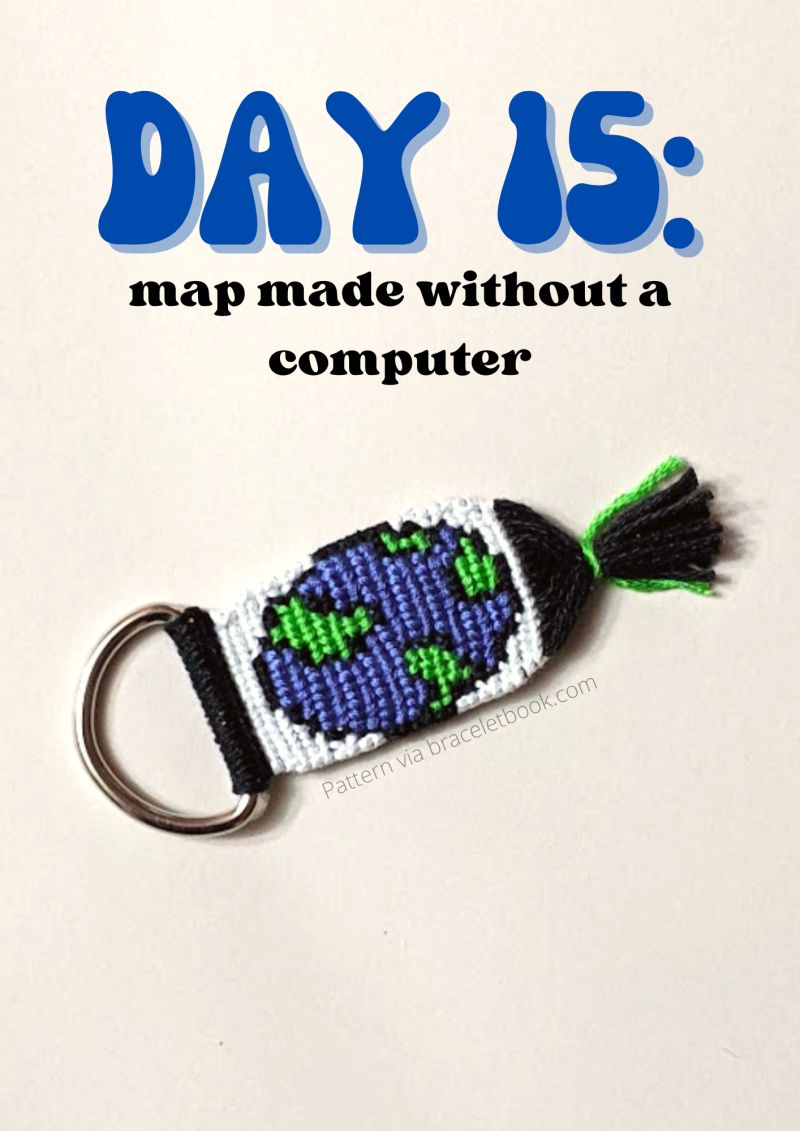
Day 15: Map made without a computer
Created with embroidery floss in macrame style: small globe with pattern via Braceletbook.com
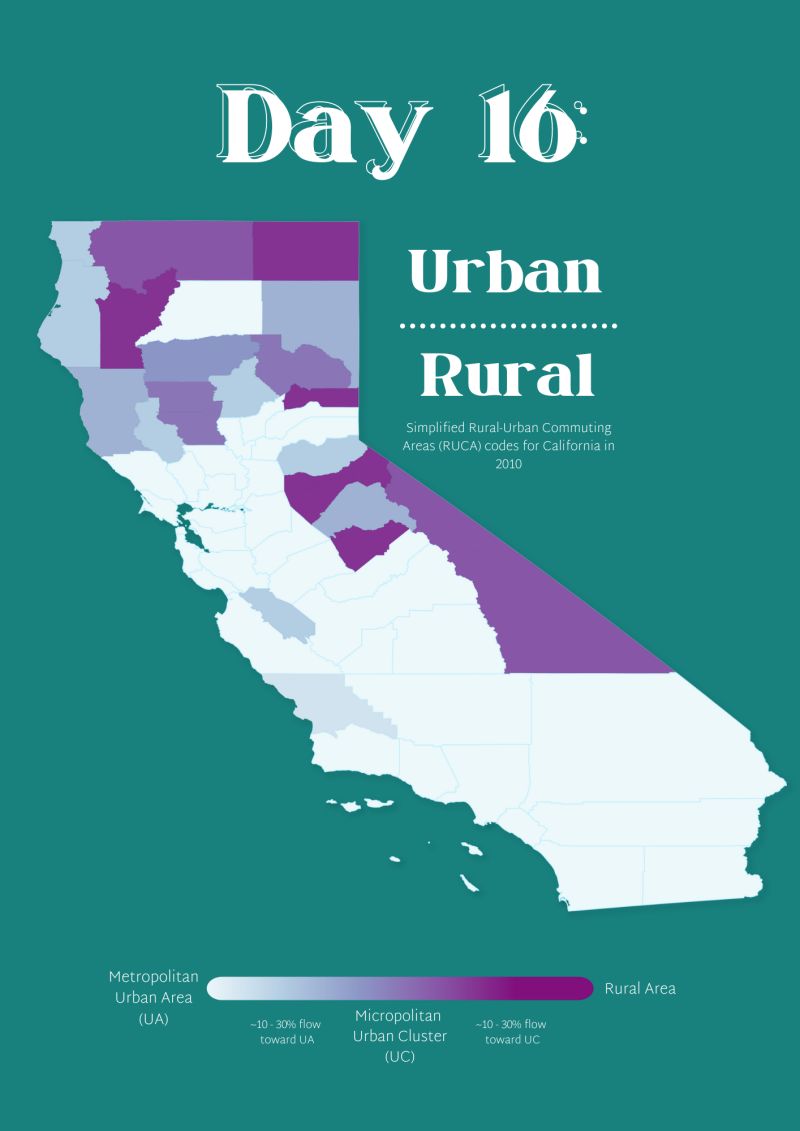
Day 16: Urban / Rural
Created in QGIS with data processed in R. Urban and Rural areas of 2010 California
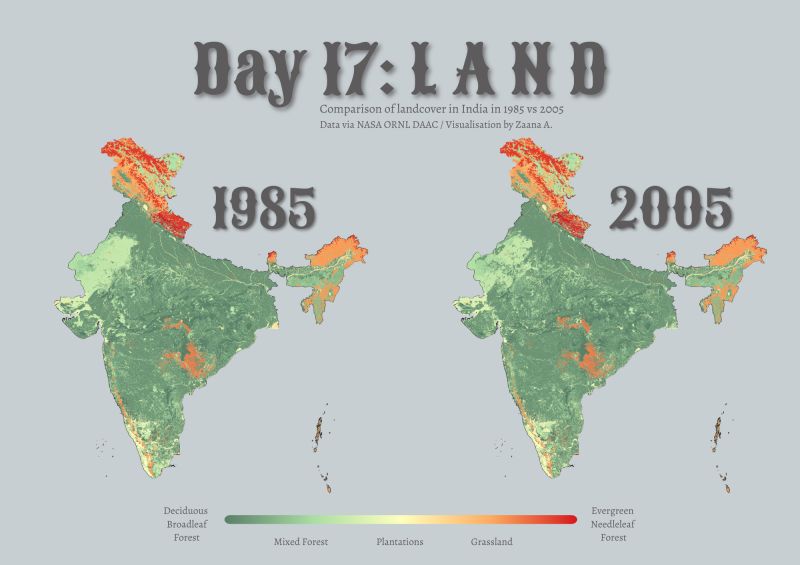
Day 17: Land
Created in QGIS. Visualising raster data of landuse in India in 1985 vs 2005
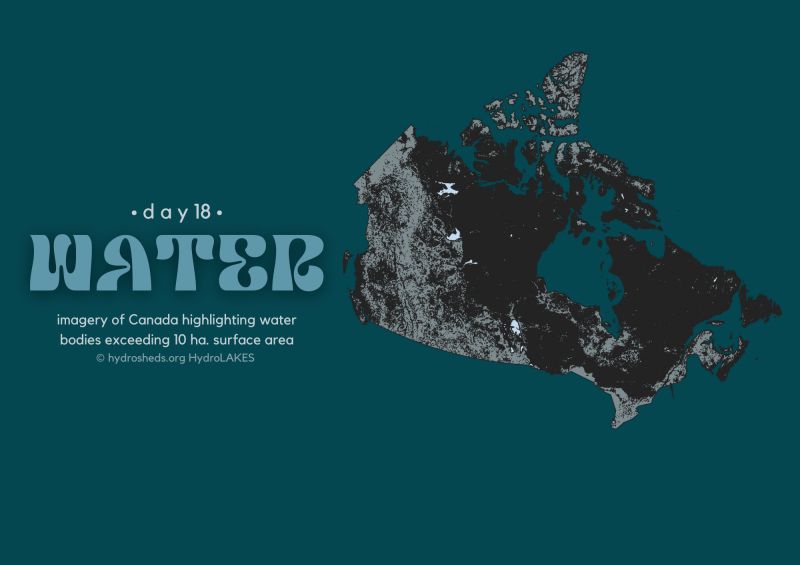
Day 18: Water
Created in QGIS. Water bodies of Canada >10 ha. in surface area
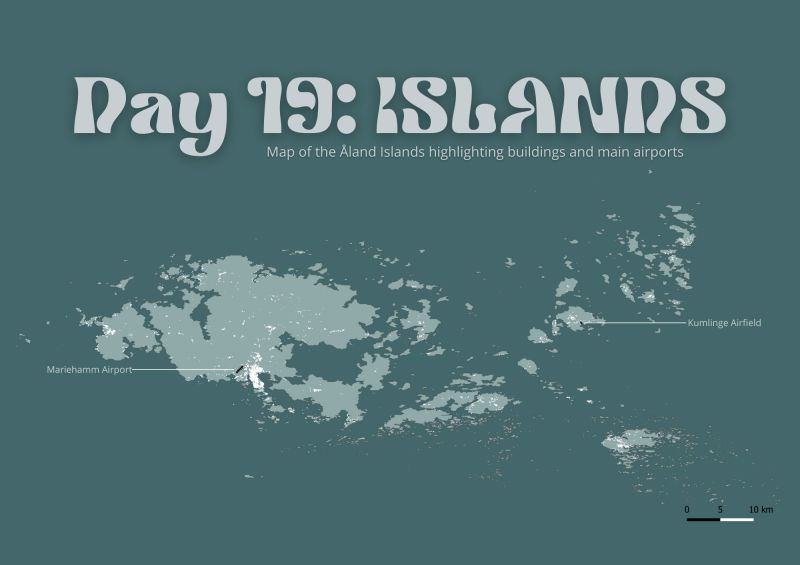
Day 19: Islands
Created in QGIS. Quick map of Åland Islands, highlighting main airports and airfields
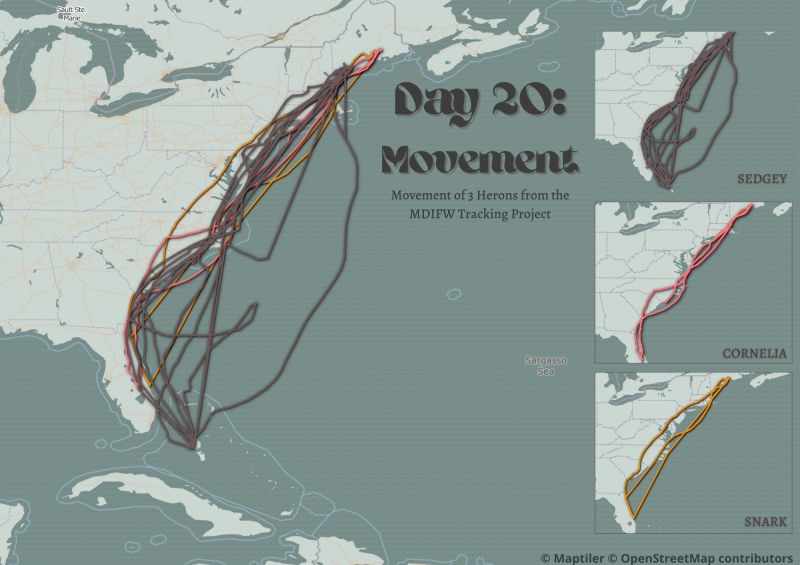
Day 20: Movement
Created in QGIS, data processed in R. Map showcasing movement of 3 Herons from the MDIFW tracking project
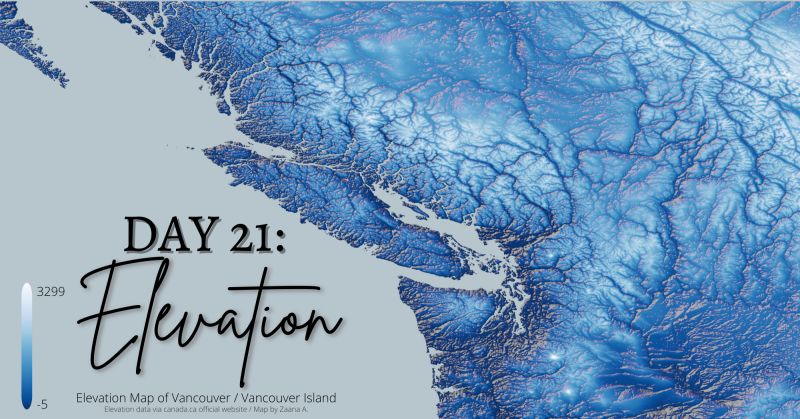
Day 21: Elevation
Created in QGIS. Elevation data of Vancouver / Vancouver Island
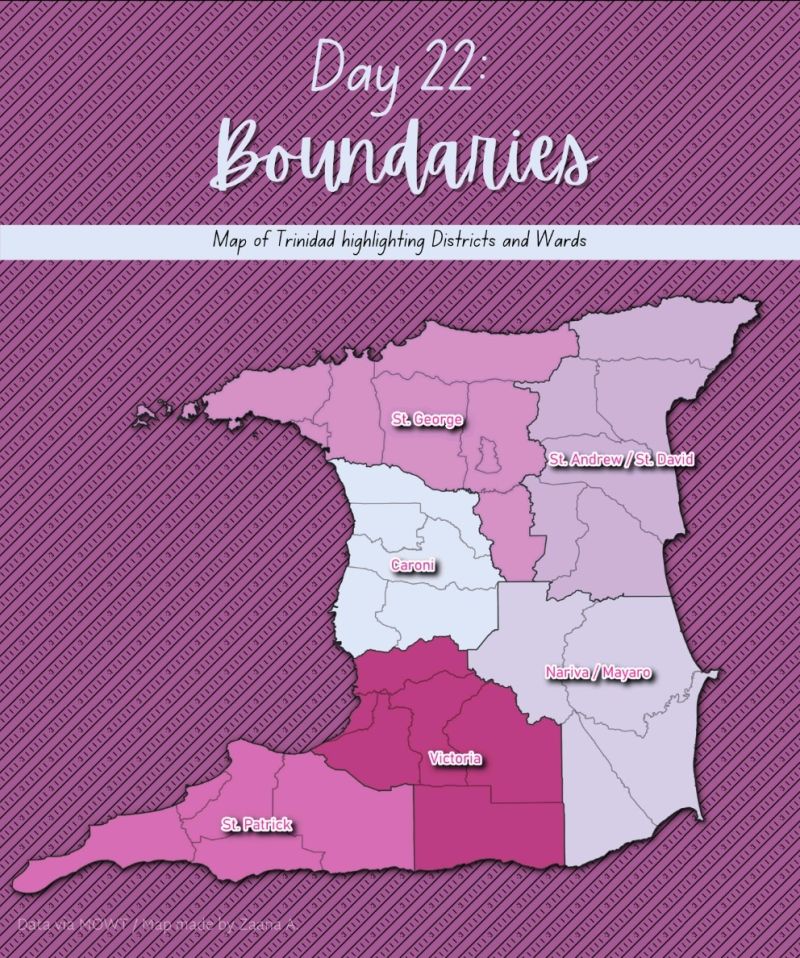
Day 22: Boundaries
Created in QGIS. Quick map highlighting the major districts within Trinidad
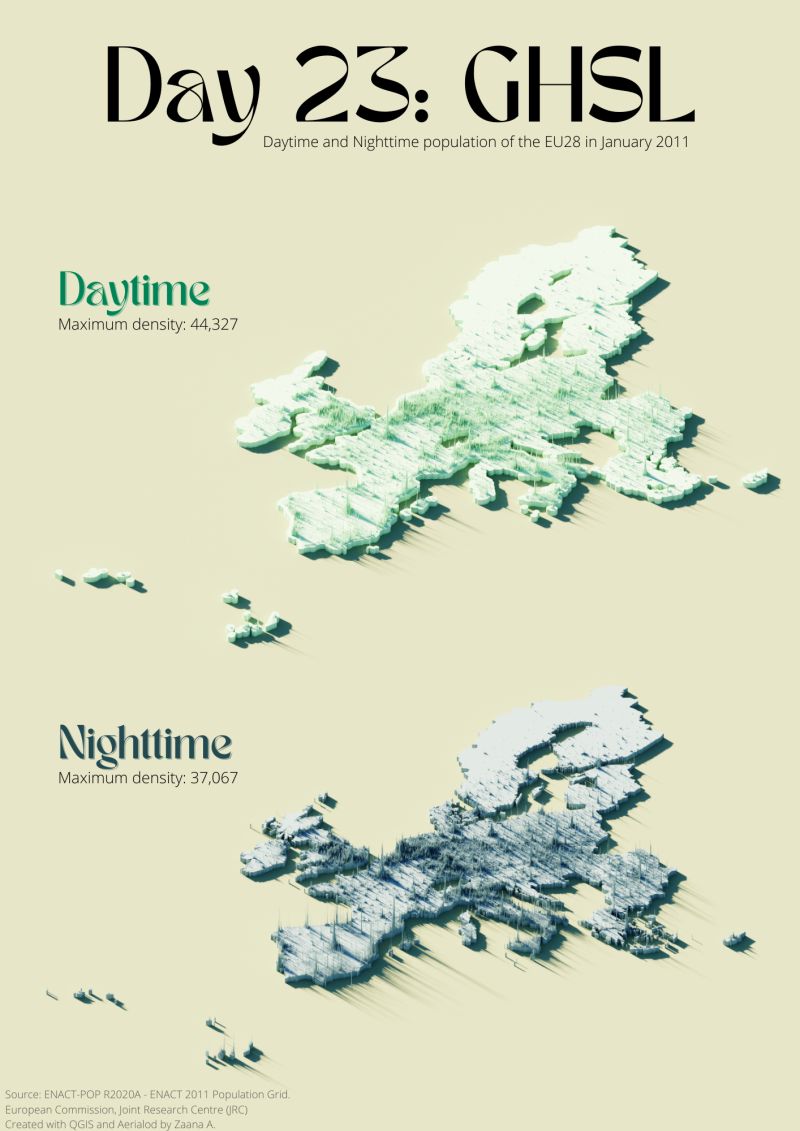
Day 23: Challenge 3: GHSL
Created in QGIS and Aerialod. Map highlighting population density in the UK
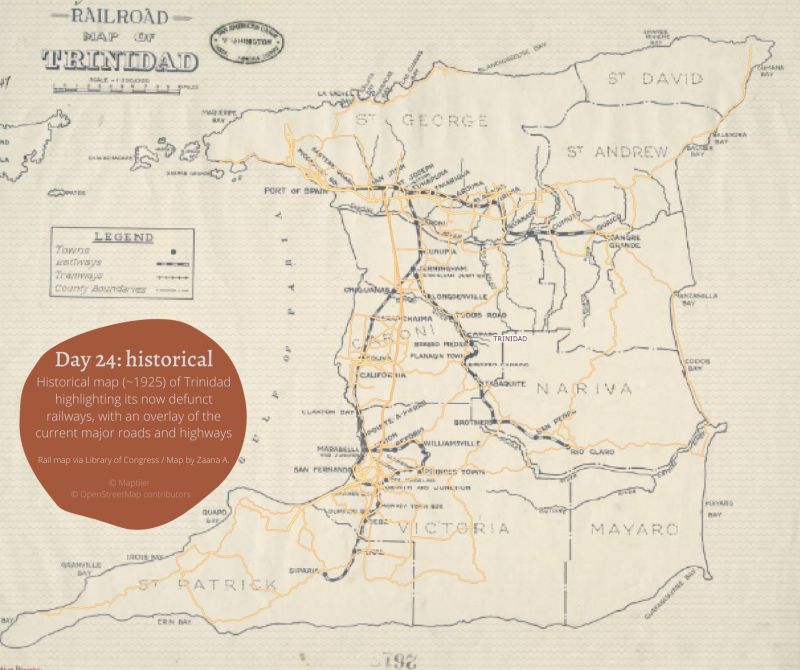
Day 24: Historical
Created in QGIS. Historical map of ~1925 Trinidad highlighting the island’s now-defunct railway, with an overlay of the current major road and highway network
Day 25: Interactive
Created with Mapbox and Github. Interactive map highlighting the usage of the Night Tube in London during the first 5 months of service. Check it out here
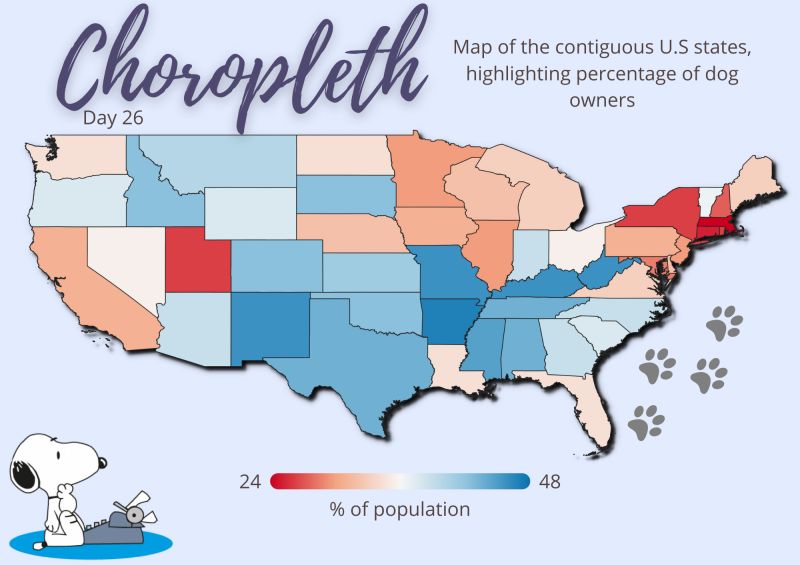
Day 26: Choropleth
Created in QGIS. Map highlighting population % of dog owners in the contiguous US states
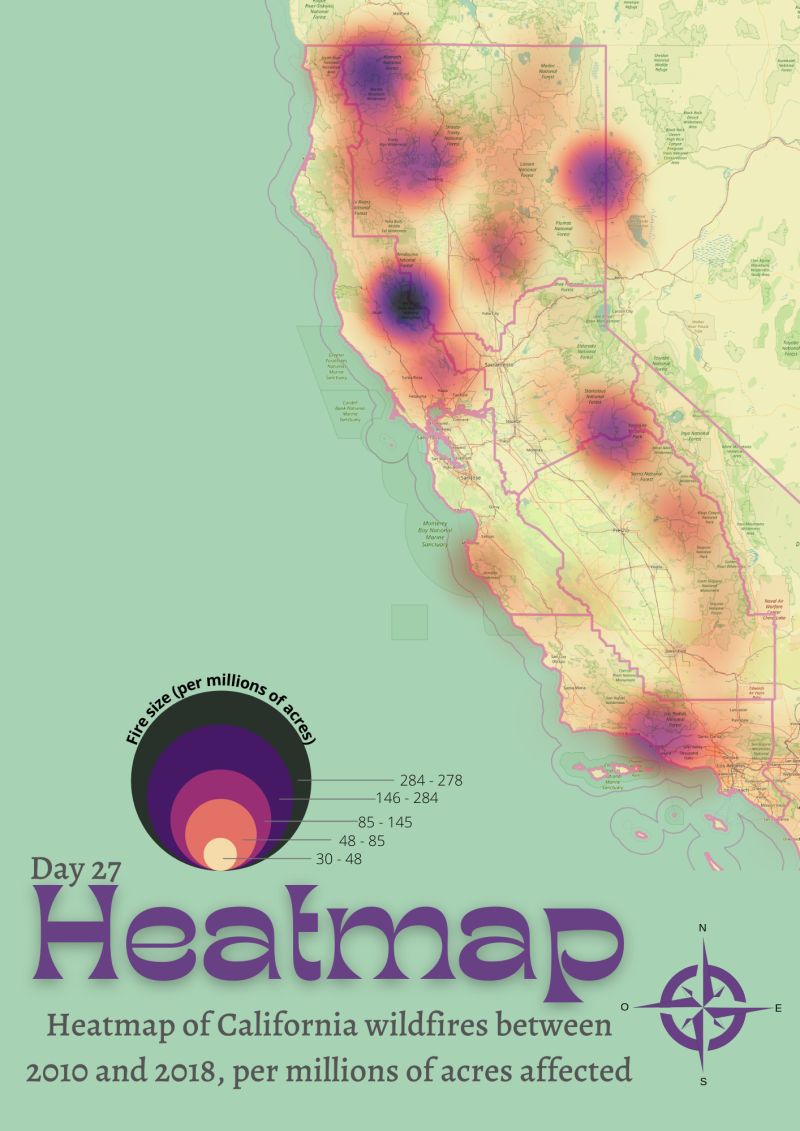
Day 27: Heatmap
Created in QGIS, data processed in R. Heatmap of wildfires in California between 2010 and 2018, per millions of acres affected
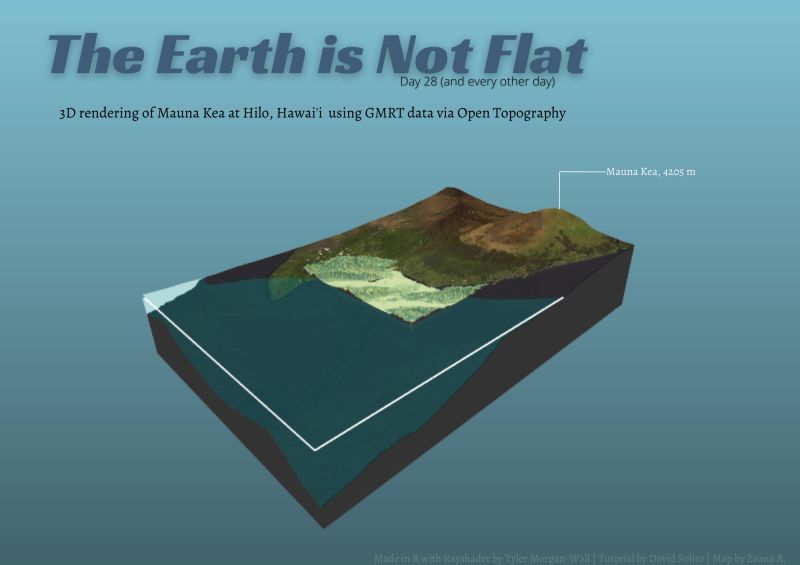
Day 28: The earth is not flat
Created in R with Rayshader. 3D Map of Hilo, Hawai’i, following the tutorial by David Solito. Rayshader attempt #2
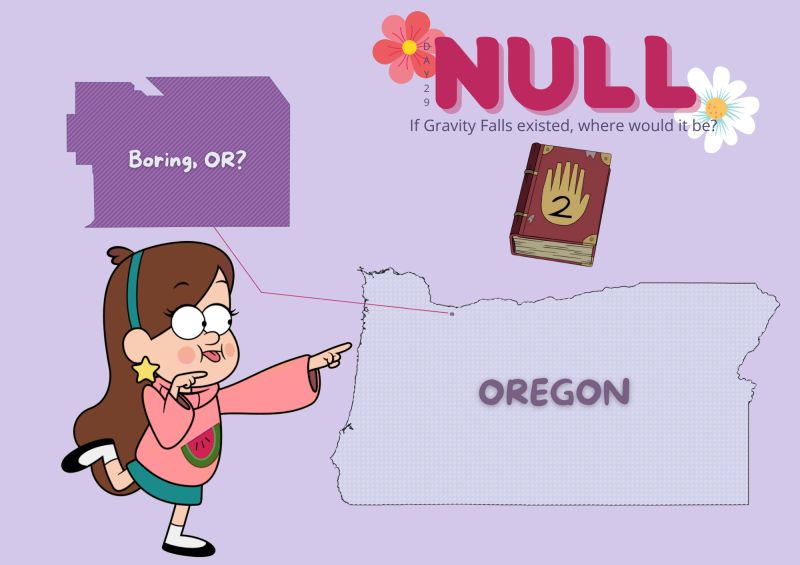
Day 29: NULL
Created in QGIS. Map of Oregon and Boring, OR, highlighting location of Gravity Falls (can you tell I had no clue what to make this day…)
And that’s about the size of it! Datasets for each map will be uploaded / linked to my repo soon! In the meantime though, feel free to reach out on my socials if you’re looking for any of the datasets!